

AI marketing ROI measures the additional business value attributable to a change against its full additional cost. Define the customer outcome, compare like-for-like work and include review, implementation and rework. More content or more clicks alone does not establish a return.
I used to be quite sure about what a landing page should look like. A certain structure, a clear message and a design that made the next step obvious.
Then I worked with Dario. Their page was long, and I did not expect it to work as well as it did. People connected with the story and trusted the people sharing their experience of the product. The page gave them space to understand it.
That experience changed my thinking. I had been judging the page through my own rules before understanding what the customer needed. It is a lesson worth taking into AI marketing, where producing another version can be much easier than establishing whether it is better.
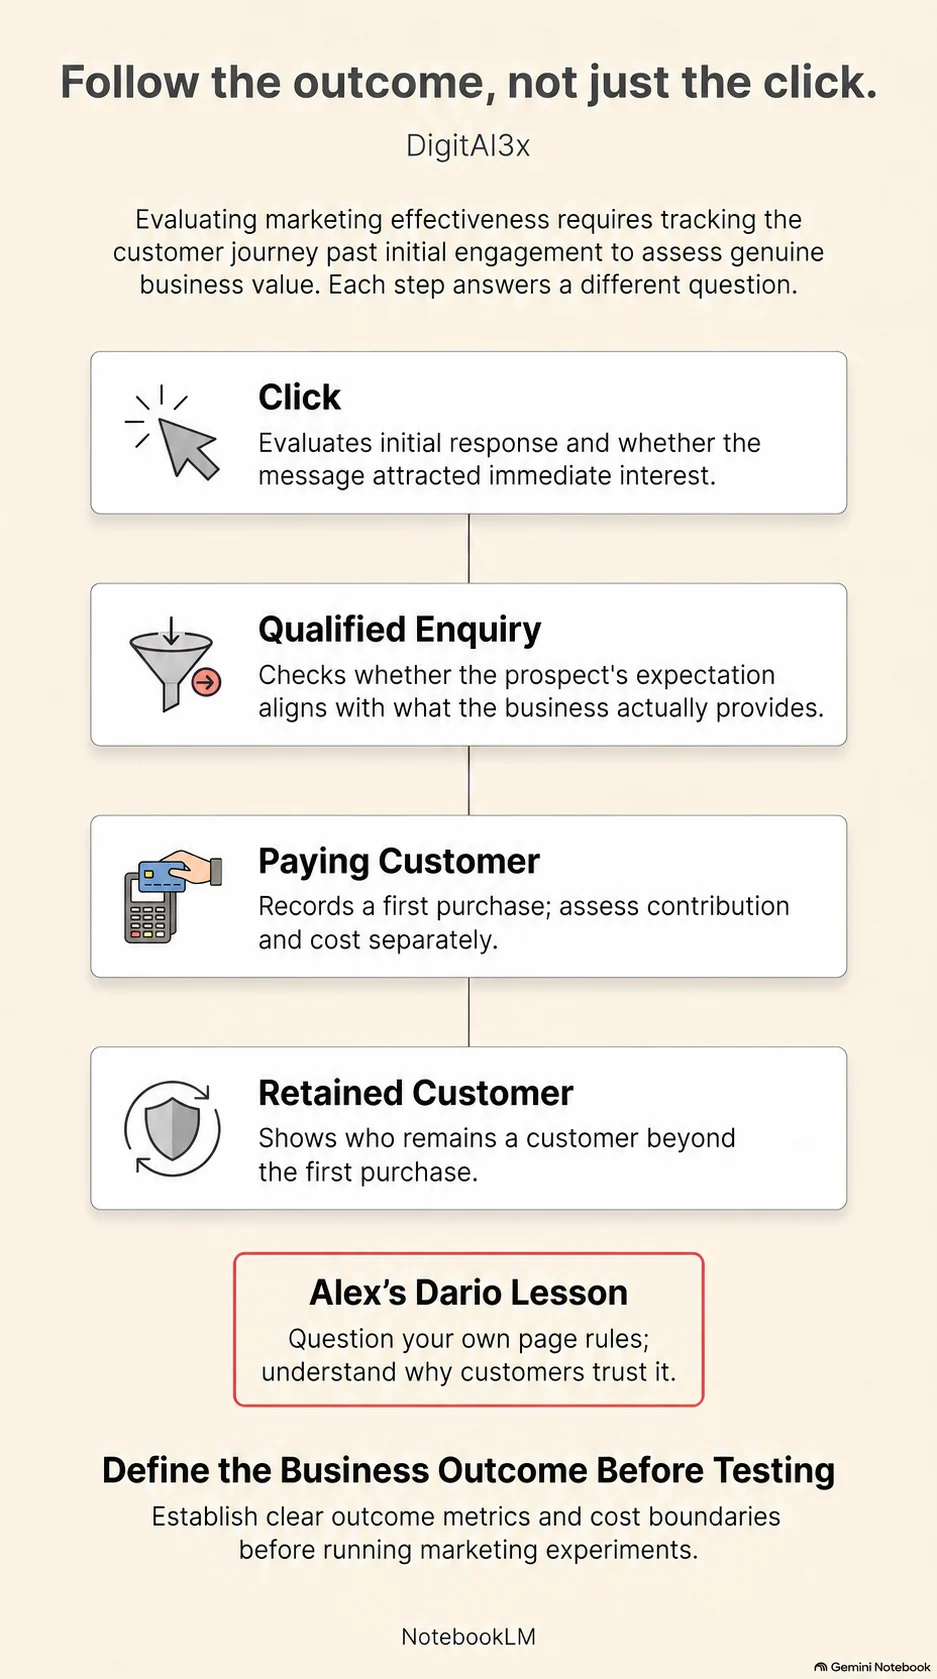
What does a better marketing result mean?
To measure AI marketing ROI, compare the additional business value attributable to the change with its full additional cost. Clicks, output volume and time saved can help explain the result, but none establishes profitability by itself.
Start by naming the outcome. For a service business, that might be qualified enquiries that become paying customers. For a subscription product, it might be customers who activate and remain subscribed. Make the definition specific enough that two people on the team would count it the same way.
Then choose the earlier signals that help you understand that outcome: click-through rate, enquiry quality, the proportion who book, or the proportion who finish onboarding. A change at one stage may be cancelled out later.
Read what an AI study actually compared
A large Facebook experiment covering nearly 35,000 advertisers reported a 6.7% increase in click-through rates for AdLlama, a model used to generate advertising text variations. Its comparison was another AI model. That is useful evidence about a particular system improvement; it is not a finding that AI beats every human marketer or increases profit by 6.7%. Read the AdLlama research.
The same care belongs in your own reporting. If one campaign reaches a different audience, has a different budget and runs during a promotion, its results do not isolate the effect of the AI-generated creative. Several things changed at once.
Keep the test small enough to understand
Choose one question, such as whether a new explanation of the offer brings more qualified enquiries. Where the platform permits it, use a randomised split with comparable audiences, budgets and timing. Decide what you will measure before viewing the result.
Give customers enough time to complete the outcome you care about. A business with a long sales cycle cannot judge acquired-customer performance from two days of clicks. With small volumes, treat early results as clues rather than declaring a winner.
Record production, review and implementation time as well as software and media costs. Count the cost of correcting mistakes. Capacity released for other work can be valuable, but it is different from cash that actually leaves the cost base.
A small scorecard for your first AI marketing test
For DigitAl3x’s AI Marketing Roadmap, I chose to start with assessment, priorities and a pilot plan. Implementation is a separate decision. The useful next step is to make that first test specific enough to review.
Use four fields: the baseline, the one change, the measure and the decision. Write the decision rule before starting. Include the person responsible for reviewing the work and a date to look at it together.
| Field | Write this before the test | Illustrative review |
|---|---|---|
| Baseline | Ten comparable replies took 120 minutes to draft, check and correct. Nine met the agreed quality standard at first review. | Use the same reply scope and quality checklist in both routes. |
| One change | AI prepares a draft from approved material. A person checks and approves every reply before sending. | Keep the offer, follow-up process and review criteria unchanged. Include all correction time. |
| Measure | Total staff minutes, first-review quality and allocated software cost. Record confirmed appointments separately from booking-link clicks. | The ten test replies took 90 minutes, but only eight met the quality standard at first review. Appointment outcomes are still pending. |
| Review decision | Continue a limited pilot only if staff time is at most 100 minutes, at least nine replies pass first review, and the allocated cost is acceptable. Stop immediately for a privacy or factual failure. | Revise and retest. The time target was met, but the quality threshold was not. Pending appointments cannot support a conversion claim. |
This example shows how a decision rule works. It is not a client result, a recommended sample size or evidence that AI saves a particular amount. A small batch can expose problems with the workflow; it cannot establish a reliable change in appointment conversion. Keep customer information in your approved systems and use totals in the scorecard.
Copy this blank scorecard
Question we want to answer:
Baseline, period and number of comparable items:
One change we will test:
What stays the same:
Measures, quality checks and full additional cost:
Continue / revise / stop rules, agreed before testing:
Owner and review date:
Observed result, including unknowns:
Decision and the reason for it:
Use one actual workflow to fill it in. If the evidence is incomplete, keep that visible and decide what you need to learn next. For a campaign comparison, use a suitable controlled test where possible; a simple before-and-after change does not isolate its cause.
Measurement note: define a successful enquiry and a confirmed appointment separately. Google’s recommended lead event and key-event guidance can support the website measurement. Booking-system confirmation is still needed to count an appointment as booked.
If you want help choosing the workflow and planning the first test, see the AI Marketing Roadmap. The introduction is free; paid work, scope, fee and timing are agreed separately.
Count the work after the first draft
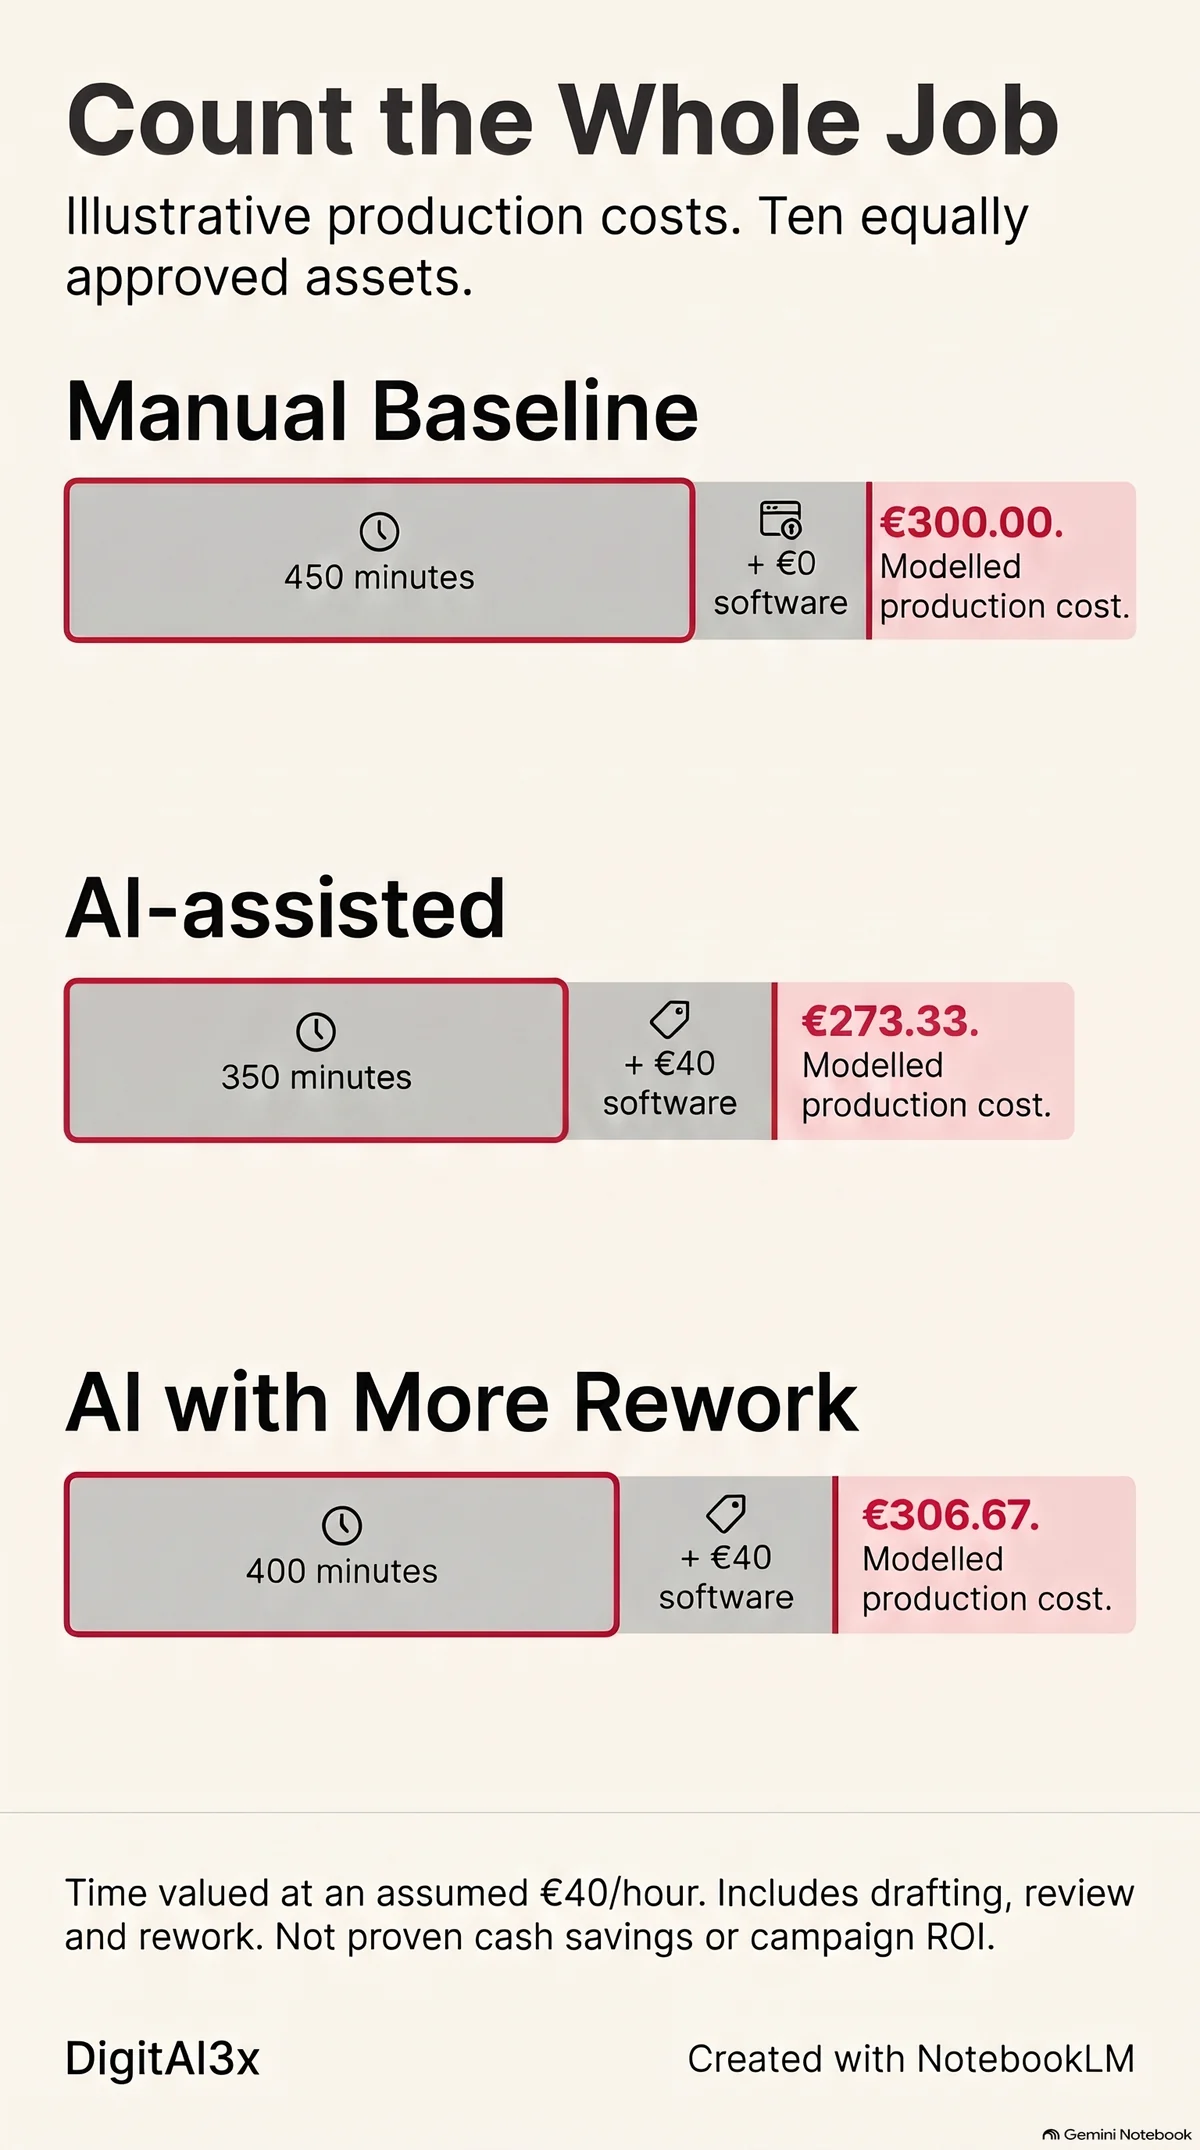
The first draft can be quicker while the finished work costs almost the same. Check the whole job: drafting, review, corrections and the software cost allocated to it.
This is an illustrative comparison, not a client result or a tool benchmark. Both routes produce ten approved marketing assets of comparable scope, judged against the same quality criteria. The minutes below are totals for the batch, including time spent on attempts that needed correcting.
| Work or cost | Manual baseline | AI-assisted | AI with more rework |
|---|---|---|---|
| Drafting, total minutes | 300 | 100 | 100 |
| Review, total minutes | 100 | 150 | 150 |
| Rework, total minutes | 50 | 100 | 150 |
| Total staff time | 450 minutes | 350 minutes | 400 minutes |
| Staff time valued at an assumed €40/hour | €300.00 | €233.33 | €266.67 |
| Allocated software cost | €0.00 | €40.00 | €40.00 |
| Modelled production cost | €300.00 | €273.33 | €306.67 |
Looking only at drafting suggests a €133.33 reduction in staff time valued at the assumed hourly cost. After review, rework and software, the modelled difference is €26.67. Add another five minutes of rework per approved asset and that route costs €6.67 more than the manual baseline.
These are values assigned to time, not proof of cash leaving the cost base. Media, distribution and other unchanged costs are outside this production-only comparison. Include any costs that differ between your own routes, use one consistent period and avoid allocating the same software bill twice. Then compare the business outcome separately: less production effort does not establish more customers or higher campaign profit.
Use the same comparison for one small job
- Define the finished unit. Write down what must be approved and the checks that both routes must pass.
- Record the full batch. Count drafting, review and rework minutes, including rejected attempts. Add the software cost attributable to this batch.
- Calculate and review. Production cost = total minutes ÷ 60 × your chosen hourly cost, plus allocated software. Compare quality and the customer or business outcome before deciding what to keep.
Download the worked comparison (CSV) · Download a blank comparison sheet (CSV). The sheets contain inputs and example figures; apply the calculation above in your spreadsheet. Use task totals rather than customer names or confidential records.
The campaign-return example below uses separate illustrative assumptions.
A simple example of AI marketing ROI
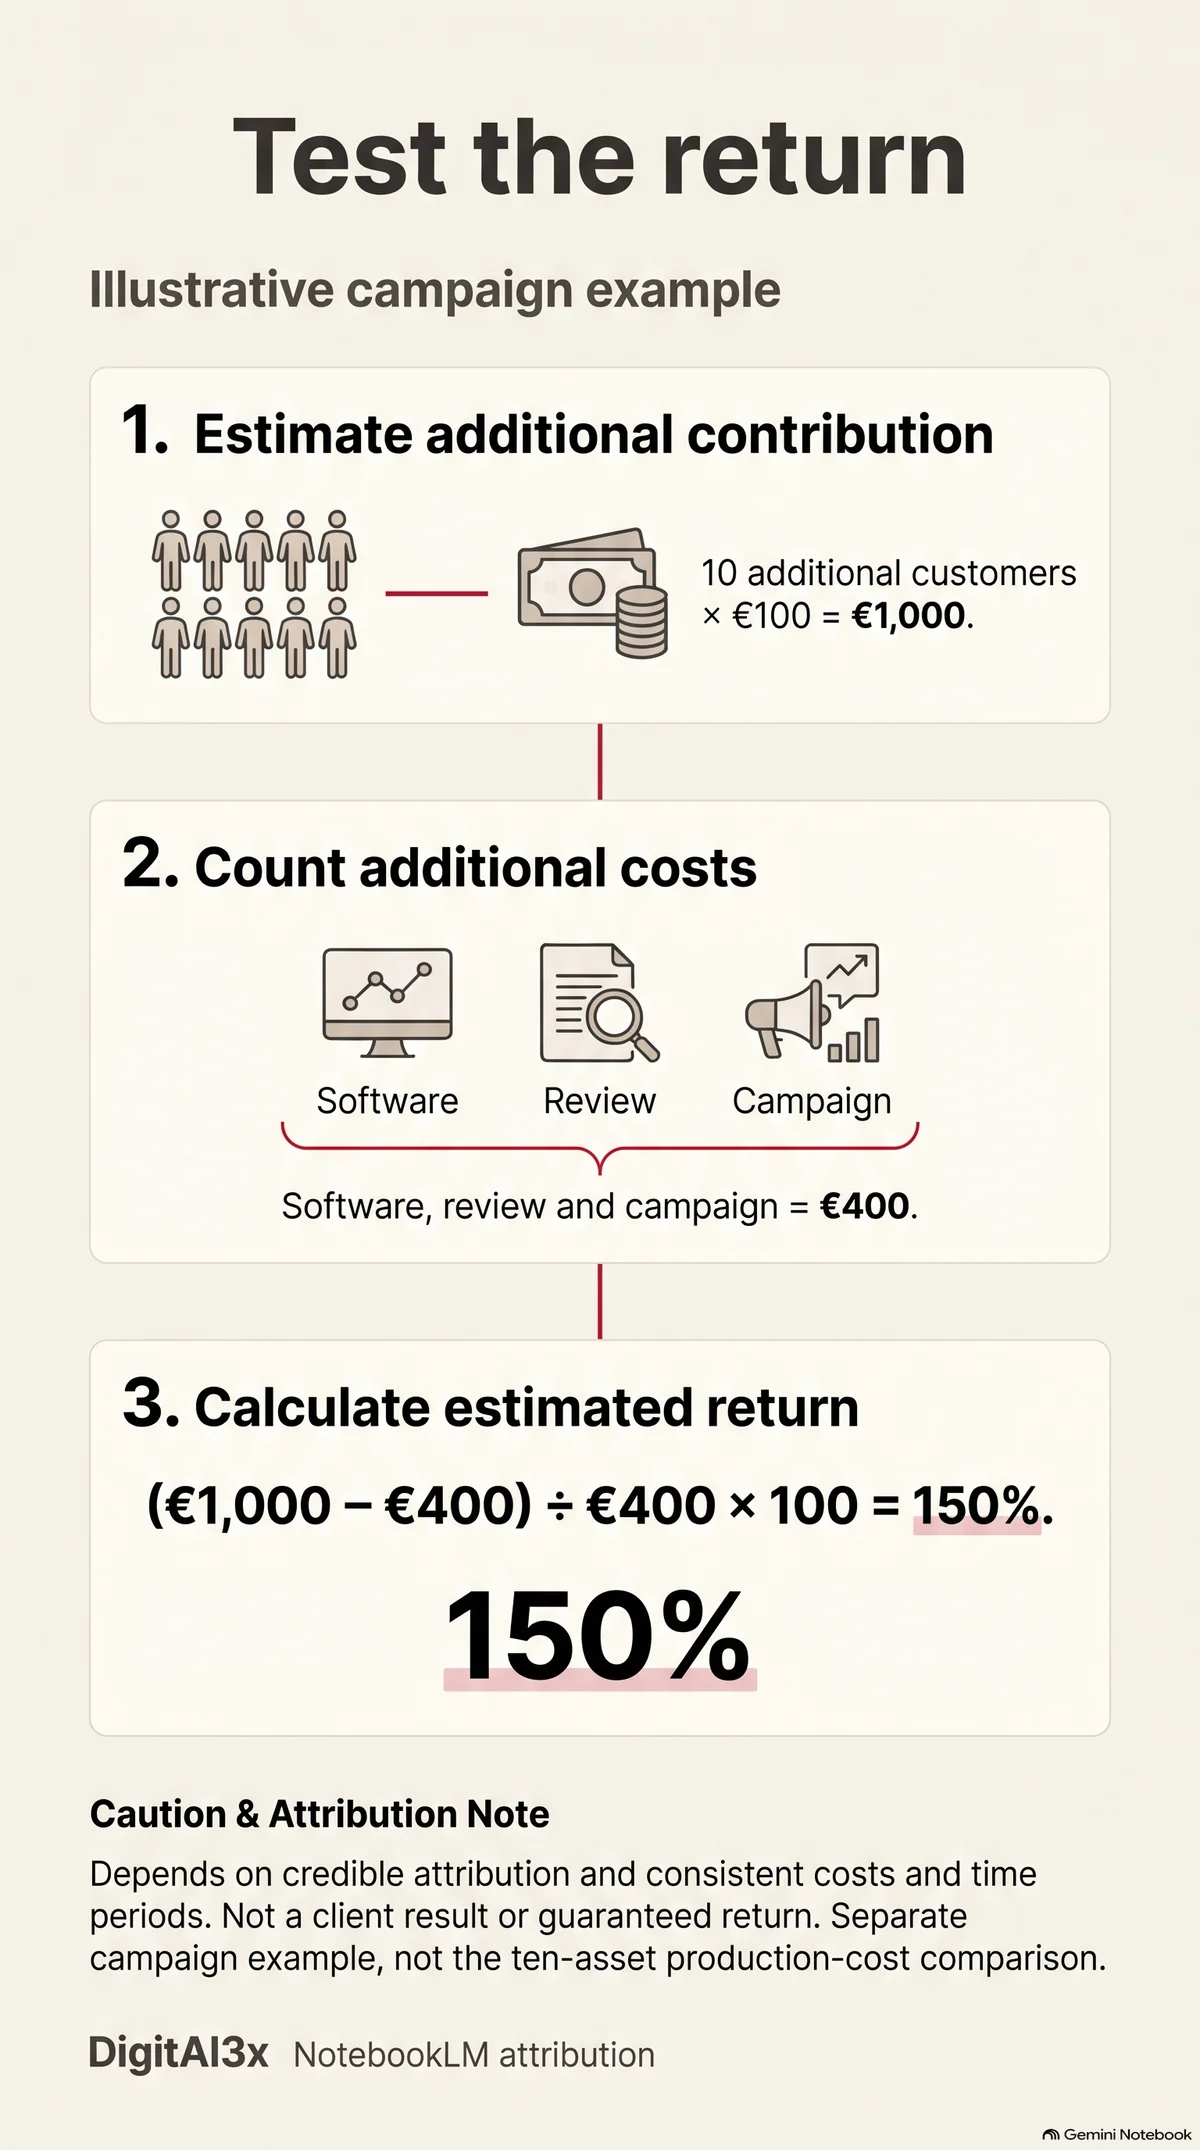
The following numbers are illustrative, not a client result. Suppose a controlled test supports an estimate of ten additional customers, each contributing €100 after the relevant delivery costs. That is €1,000 in additional contribution. If the extra software, creative review and campaign costs total €400, the estimated net gain is €600.
The return on those additional costs is (€1,000 − €400) ÷ €400 × 100 = 150%. This calculation depends on the incremental-customer estimate being credible and on using consistent costs and time periods. Refunds, cancellations or later delivery costs could change it.
Where the evidence cannot support attribution, call the result an estimate. Do not turn every sale after a tool was introduced into a sale caused by that tool.
Follow the customer after the conversion
My work across acquisition and retention is part of why I look beyond the first response. A campaign can bring in people who are interested enough to click but poorly matched to what the business provides. The question then becomes whether the message attracted the right expectation.
At Dario, I learned that my preference for a page mattered less than the customer’s reasons for trusting it. With AI-generated marketing, the same discipline applies: keep looking at what people actually do, including what happens after they buy.